
BI: Hospital Management Intelligence
What Is BI?
Analysing Hospital Management, Improving Efficiency and Enhancing Patient Services
As healthcare becomes increasingly digital, everyday clinical practice generates enormous volumes of information. Hospital management now requires centralised access not only to electronic medical records but also to HR and payroll data, pharmaceutical and supply data, and accounting information, with a real-time understanding of current conditions.
Our BI tool aims to improve hospital quality from the perspectives of patients, healthcare staff, the social environment and management. It classifies, extracts and processes data in six categories: management indicators, clinical indicators, patient safety, patient satisfaction, workload and HR indicators. This supports detailed management analysis, operational efficiency and better patient services. Each indicator can also be benchmarked against Group hospitals to provide an objective view of local performance.
Data is classified, extracted and processed in the following six categories:
Management Analysis
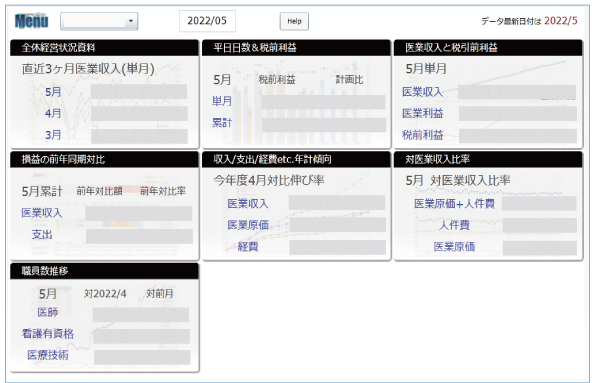 Management overview
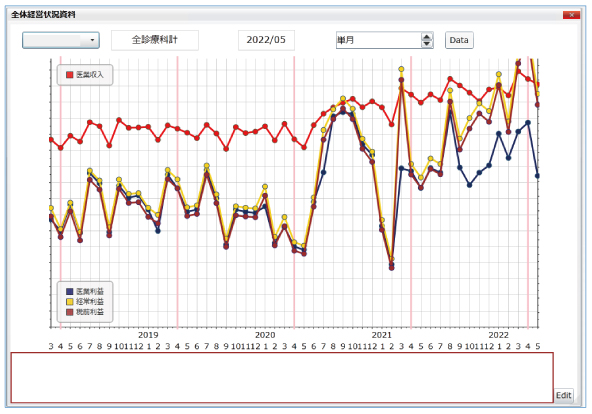 Management trends over the past five years
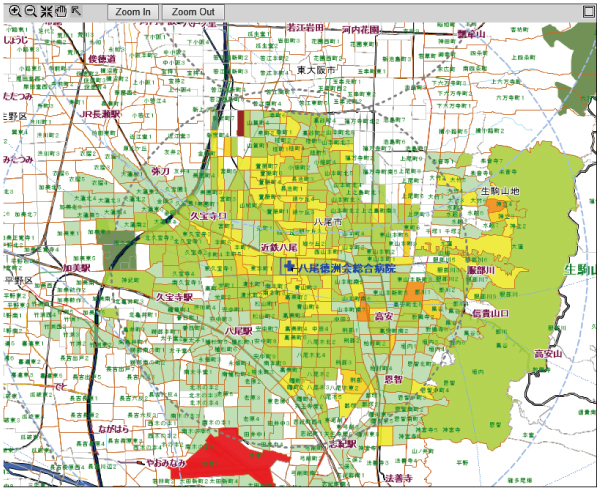 Patient catchment area map
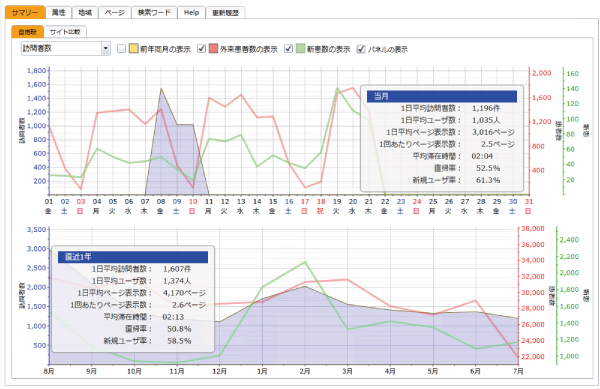 Website traffic analysis
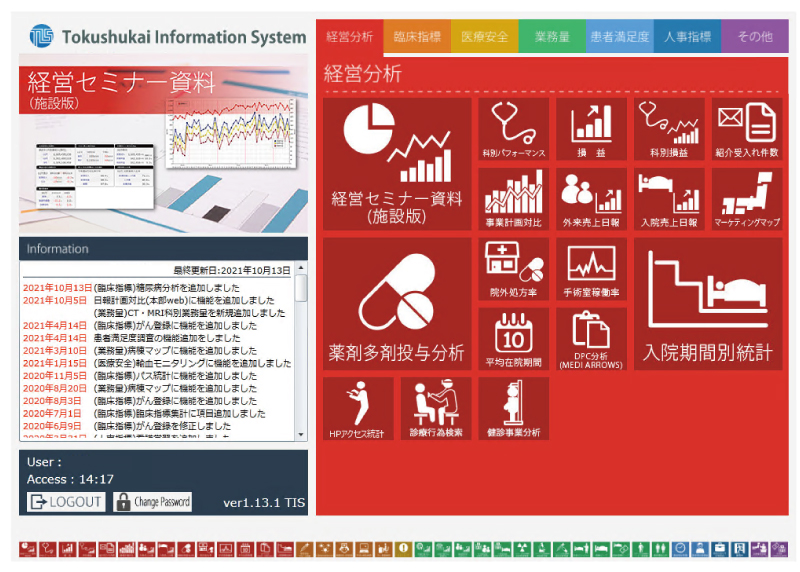
These functions show management performance from multiple perspectives. An overview combines profit and loss, patient visits and staff numbers. Other views include profit and loss by clinical department, utilisation of operating theatres as a costly resource, length of stay by admission period, maps showing areas from which few patients visit, and website browsing analysis.
Clinical Indicators
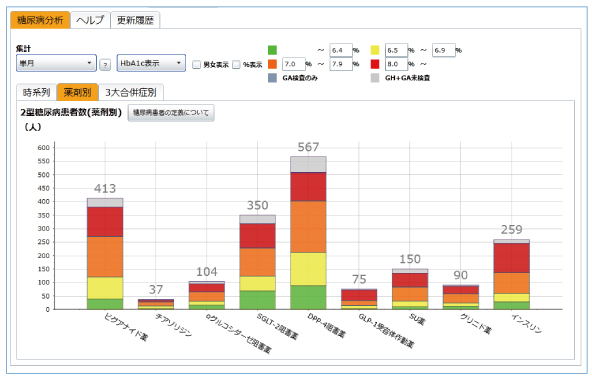 HbA1c control in patients with diabetes
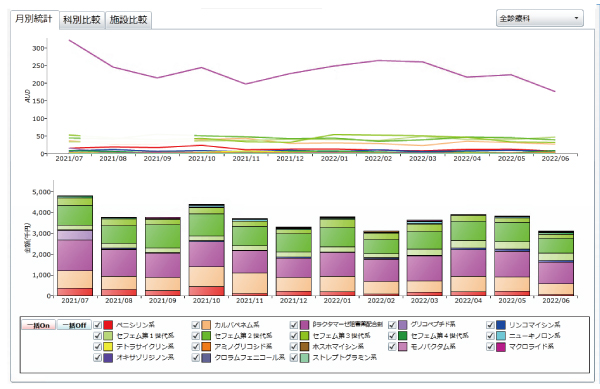 Trends in antimicrobial use density by drug class
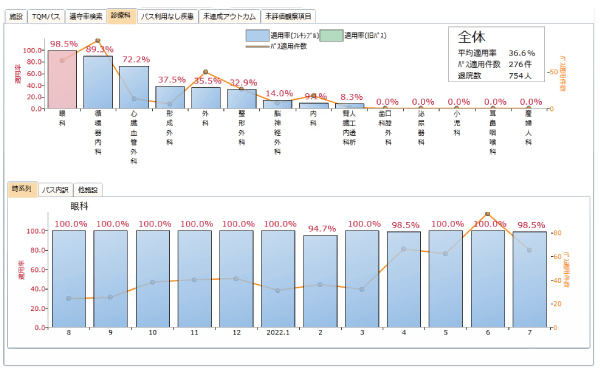 Clinical pathway use
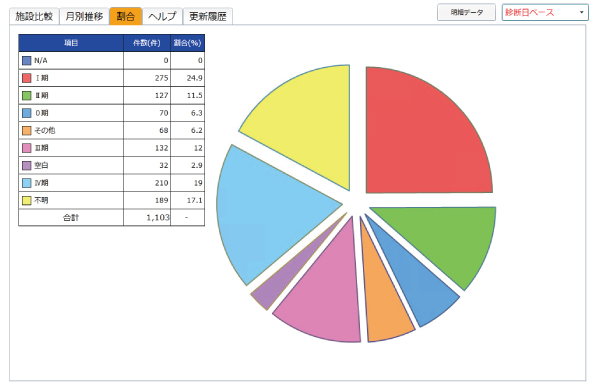 Cancer registry statistics
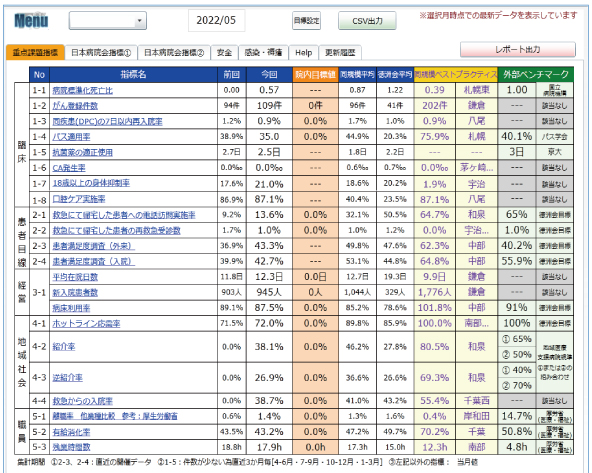 Clinical indicators prioritised across the Group
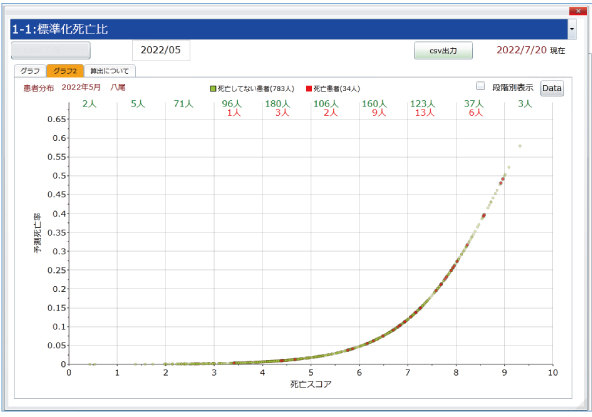 Example: standardised mortality ratio
These functions display treatment-related statistics, including HbA1c control in patients with diabetes, protocol use in cancer patients, trends in antimicrobial use density by class, and clinical pathway use. The Group also sets annual priority indicators for improving care quality, helping share best practices.
Patient Safety
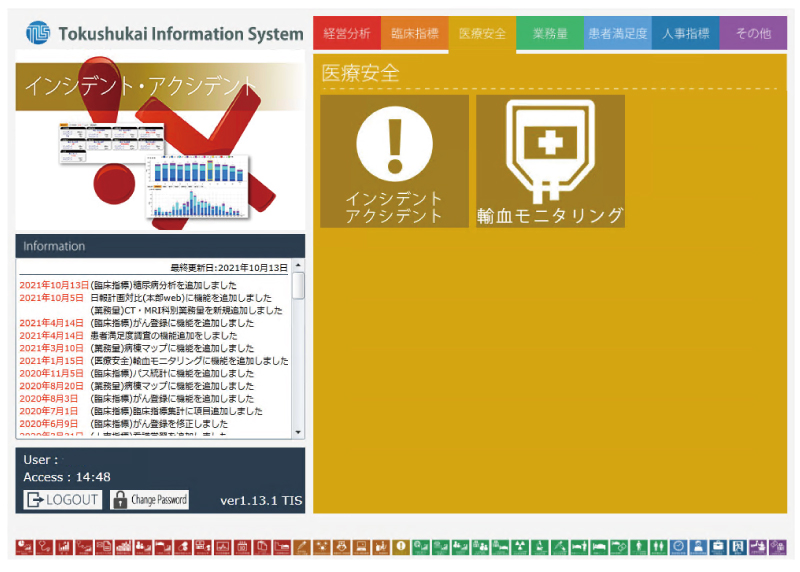
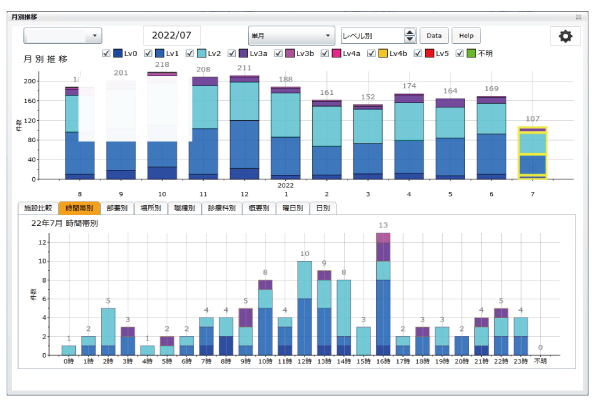 Incidents by time of day
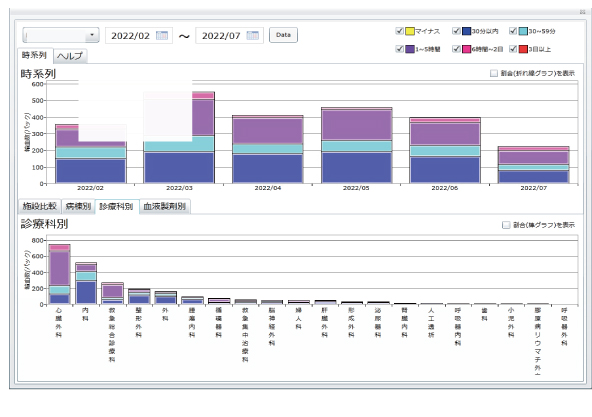 Blood transfusion monitoring
Incident and accident reports can be benchmarked between hospitals, departments and clinical specialties using categories such as time, staff profession and event summary. The aim is to encourage operational reviews that lead to improvement.
Workload
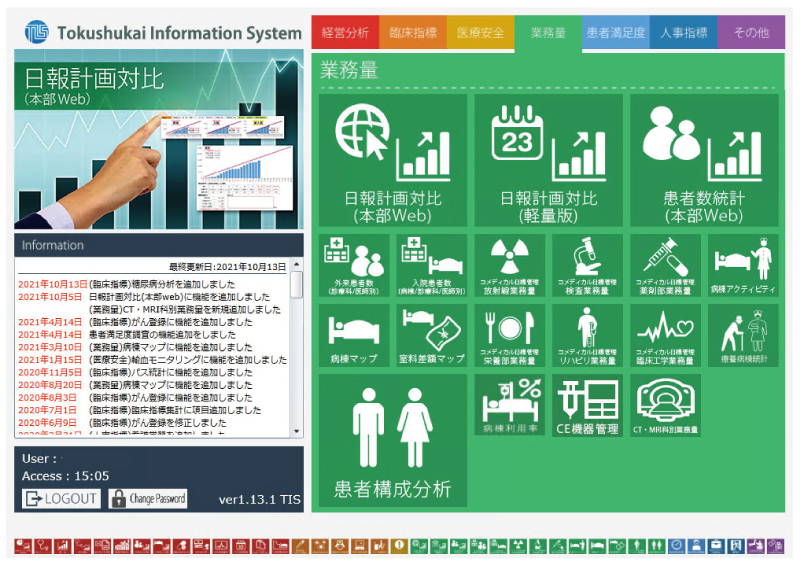
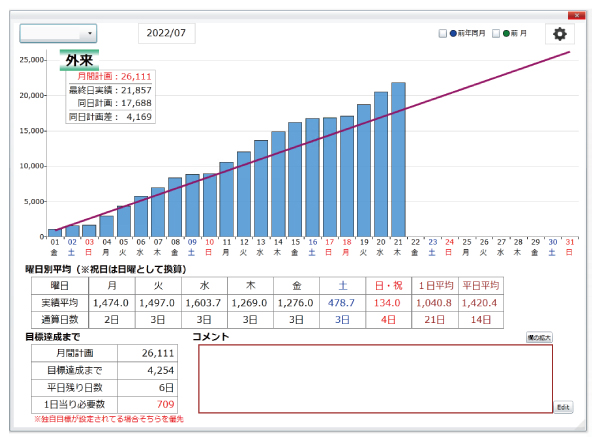 Daily performance against targets
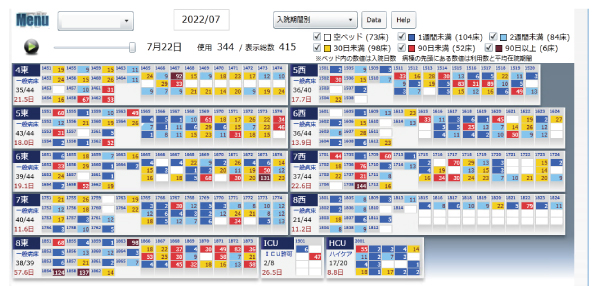 Ward map
These functions show daily workloads for the hospital, clinical departments, wards and allied health staff, including comparisons with daily plans and workload per person. Ward maps show current bed use and support discharge planning for long-stay patients and ward organisation.
Patient Satisfaction
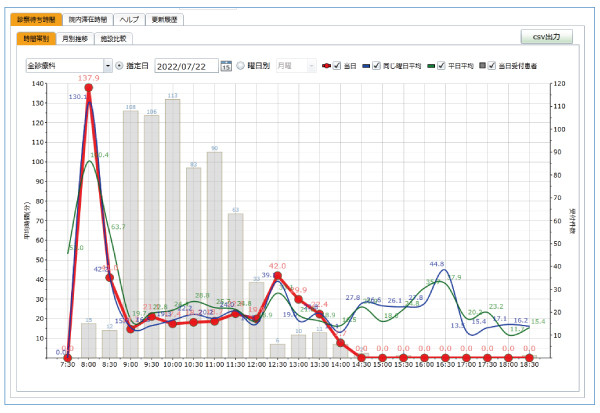 Consultation waiting times by time of day
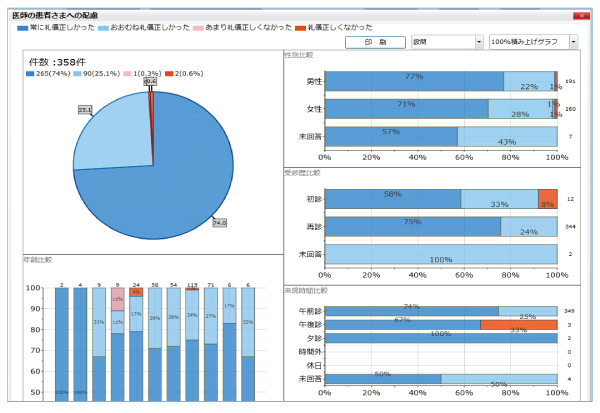 Patient satisfaction survey
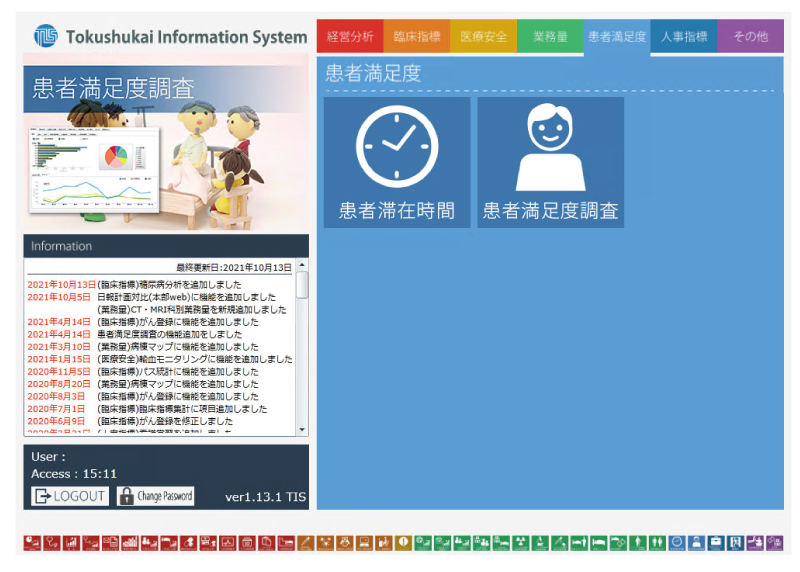
These indicators take the patient's perspective. They show waiting times before consultation and total time from arrival to payment by clinical department, as well as the Group's standard patient satisfaction survey results. Survey results can be benchmarked against other hospitals using patient characteristics such as age, area of residence, arrival time and clinical department.
HR Indicators
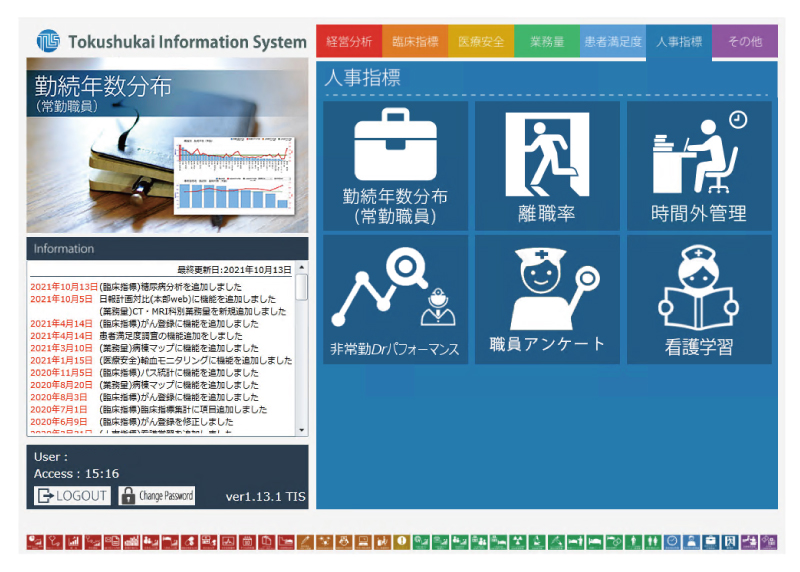
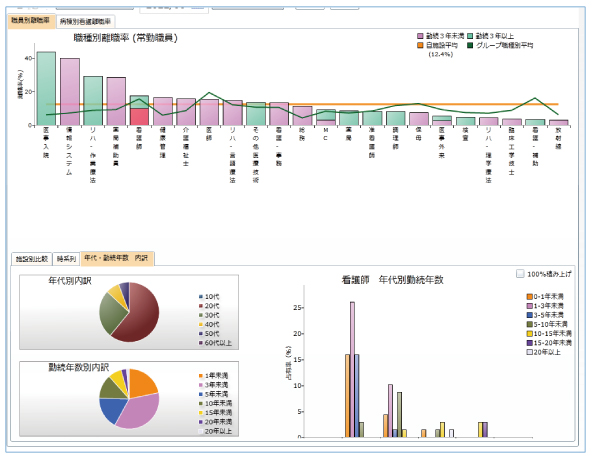 Staff turnover by department
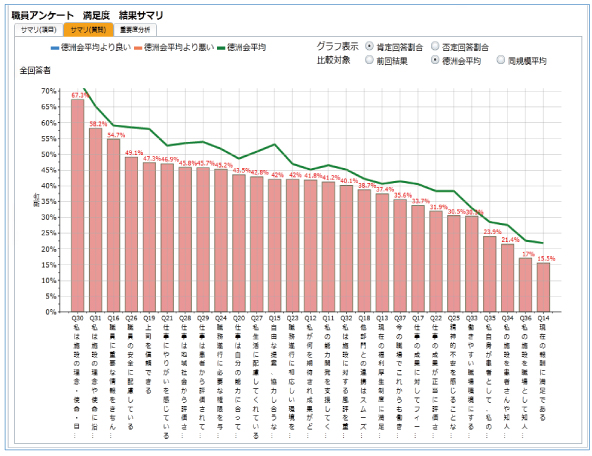 Staff survey
These functions show employment conditions such as length of service, staff turnover and overtime.
The Group conducts staff satisfaction surveys to improve the working environment and provide safe, high-quality care. Our analysis functions allow individual questions to be benchmarked between departments and hospitals, helping teams share effective practices and consider improvements.
Features and Benefits
Aggregating Information
Integration with other systems brings together revenue, expenditure, HR, workload, medical procedures, pharmaceuticals and medical supply data. Combining these data enables a comprehensive assessment at a glance.
Drill-Down Analysis
Data is linked at the detailed record level, allowing users to drill down from
the Group to a hospital, then to a clinical department or organisational unit, and finally to an individual
, helping identify issues quickly.
Sharing Improvements through Benchmarking
Comparison with other hospitals and clinical departments helps teams understand their position and encourages improvement towards exemplary hospital management. Sharing data across the Group also makes problems visible, allowing the Group to respond collectively.
Functions
Management Analysis
| Function | Description |
|---|---|
| Management seminar materials | Displays a summary of management performance. |
| Profit and loss | Displays detailed profit and loss data. |
| Profit and loss by clinical department | Displays profit and loss for each clinical department. |
| Incoming referrals | Shows which healthcare providers send more referrals and which are sending fewer. |
| Performance against business plan | Shows monthly and year-to-date differences from the business plan, along with year-on-year comparisons. |
| Marketing map | Plots patient locations to show areas with declining visits. Registering nearby healthcare providers also allows changes in incoming and outgoing referrals to be mapped. |
| Operating theatre utilisation | Shows utilisation by operating theatre, operating time by doctor, and differences between planned and actual duration. |
| Average length of stay | Shows average length of stay by ward, clinical department, condition and doctor. |
| Statistics by admission period | Shows patient numbers by DPC admission period, including patients currently hospitalised. |
| Website traffic statistics | Displays access log data for hospital websites developed by our team. |
| Medical procedure search | Shows billed procedures by claims code for each hospital, using medical administration data. |
| Health screening analysis | Displays health screening statistics. |
Clinical Indicators
| Function | Description |
|---|---|
| Diabetes analysis | Shows HbA1c control in patients with diabetes. |
| Antimicrobial use density | Shows antimicrobial use density. |
| Oncology protocol use and adverse event statistics | Shows regimen use and adverse event statistics. |
| Nursing diagnoses | Shows statistics based on NANDA nursing diagnoses. |
| Surgery and diagnosis search | Shows statistics for patients matching specified procedures or diagnoses. |
| Disease map | Maps patients with heat illness or influenza to show their geographical distribution. |
| Cancer registry statistics | Shows hospital cancer registry data by cancer type, stage and site. |
| Clinical pathway statistics | Shows clinical pathway utilisation rates. |
| Pressure injury statistics | Shows incidence, depth, site and other statistics from pressure injury assessments. |
| Influenza trends | Shows weekly influenza patient counts in real time. |
Patient Safety
| Function | Description |
|---|---|
| Incidents and accidents | Shows statistics from incident and accident reports. |
| Blood transfusion monitoring | Shows statistics such as unverified transfusions and the time from issue to verification. |
Workload
| Function | Description |
|---|---|
| Daily performance against plan | Shows daily workload and planned values. |
| Outpatient and inpatient counts | Shows daily outpatient and inpatient counts in real time by clinical department and doctor. |
| Allied health target management | Compares workload per person against targets for each allied health department. |
| Ward activity | Shows patient counts, average length of stay, incident counts and nursing care need statistics for each ward. |
| Ward map | Shows use of each bed in real time. |
| Private room charge map | Shows collection of charges for each bed with a private room supplement. |
| Patient profile analysis | Shows patient composition by age and clinical department. |
| Ward utilisation | Shows use by ward and data by DPC admission period. |
| Clinical engineering equipment management | Shows equipment loan rates and failure counts at month-end. |
| CT and MRI workload by clinical department | Shows CT and MRI workload for each clinical department. |
Patient Satisfaction
| Function | Description |
|---|---|
| Time spent in hospital | Shows each patient's time from registration to consultation and from registration to payment in real time. |
| Patient satisfaction survey | Shows patient satisfaction survey results. |
HR Indicators
| Function | Description |
|---|---|
| Length-of-service distribution | Shows length of service by profession and department. |
| Staff turnover | Shows turnover by profession and department. |
| Overtime management | Shows overtime data. |
| Part-time doctor performance | Shows outpatient numbers and pay for part-time doctors. |
| Staff survey | Shows staff satisfaction survey results. |
| Nursing education | Shows Nursing Skills course participation. |
System Requirements
| Client | OS | Windows 7 or later |
|---|---|---|
| CPU | 1 GHz or faster | |
| Memory | 1 GB or more | |
| Display | SXGA or higher | |
| Browser | Internet Explorer 9 or later | |
| Network Protocol | HTTP | |
Implementation Process
Contact the Information System Department by phone or through the contact form.
Arrange a meeting to discuss your requirements.
We prepare a demonstration and provide a quotation.
Application and contract
Trial implementation after several meetings
Start of operation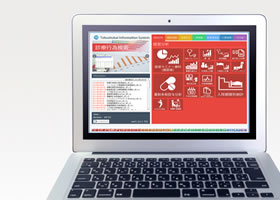
Maintenance
Meet the Team
Atsushi Manabe, Assistant Manager, systems business team

| Team | Systems business team |
|---|---|
| Home Prefecture | Kanagawa |
Case Study
Tokyo Nishi Tokushukai Hospital(Akishima, Tokyo)
System implemented: BI tool
Department Leaders Drive Improvement through the BI Tool Club
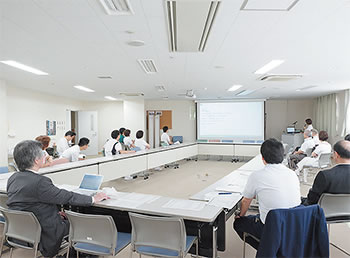 A presentation at the BI Tool Club
Department leaders use the BI tool to deepen their understanding of hospital management and increase motivation. The club meets for 30 minutes from 7:30 every Friday, with presentations by leaders from nursing, allied health and administration. The hospital director commented: “Sharing information is essential to providing better care. The BI tool is a very effective means of doing this.”
Implementation Record
Hokkaido
| Hospital | Address |
|---|---|
| Sapporo Higashi Tokushukai Hospital | 14-3-1 Kita 33-jo Higashi, Higashi-ku, Sapporo, Hokkaido |
| Sapporo Minami Tokushukai Hospital | 1-5-1 Hiraoka 5-jo, Kiyota-ku, Sapporo, Hokkaido |
| Sapporo Tokushukai Hospital | 1-1-1 Oyachi-higashi, Atsubetsu-ku, Sapporo, Hokkaido |
| Kyoaikai Hospital | 7-21 Nakajima-cho, Hakodate, Hokkaido |
| Hidaka Tokushukai Hospital | 1-10-27 Shizunai Kosei-cho, Shinhidaka-cho, Hidaka-gun, Hokkaido |
| Obihiro Tokushukai Hospital | 14-2-1 Kino-nishidori, Otofuke-cho, Kato-gun, Hokkaido |
Tohoku
| Hospital | Address |
|---|---|
| Sendai Tokushukai Hospital | 15 Kagozawa, Nanakita, Izumi-ku, Sendai, Miyagi |
| Shinjo Tokushukai Hospital | 4623 Komaba, Torigoe, Shinjo, Yamagata |
| Shonai Amarume Hospital | 1-1-1 Shoyo, Shonai-machi, Higashitagawa-gun, Yamagata |
| Yamagata Tokushukai Hospital | 2-3-51 Kiyozumi-cho, Yamagata |
| Sanpoku Tokushukai Hospital | 1340-1 Gatsugi, Murakami, Niigata |
Kanto
| Hospital | Address |
|---|---|
| Koga General Hospital | 1555 Konosu, Koga, Ibaraki |
| Musashino Tokushukai Hospital | 3-5-48 Mukodai-cho, Nishitokyo, Tokyo |
| Tokyo Nishi Tokushukai Hospital | 3-1-1 Matsubara-cho, Akishima, Tokyo |
| Yotsukaido Tokushukai Hospital | 1830-1 Yoshioka, Yotsukaido, Chiba |
| Shonan Atsugi Hospital | 118-1 Nurumizu, Atsugi, Kanagawa |
| Yamato Tokushukai Hospital | 4-4-12 Chuo, Yamato, Kanagawa |
| Shonan Fujisawa Tokushukai Hospital | 1-5-1 Tsujido-kandai, Fujisawa, Kanagawa |
| Shonan Kamakura General Hospital | 1370-1 Okamoto, Kamakura, Kanagawa |
| Chigasaki Tokushukai Hospital | 14-1 Saiwai-cho, Chigasaki, Kanagawa |
| Hayama Heart Center | 1898-1 Shimoyamaguchi, Hayama-machi, Miura-gun, Kanagawa |
| Yamauchi Hospital | 4-6 Minami-Fujisawa, Fujisawa, Kanagawa |
| Tateyama Hospital | 196 Nagasuka, Tateyama, Chiba |
| Chiba-Nishi General Hospital | 107-1 Kanegasaku, Matsudo, Chiba |
| Kamagaya General Hospital | 929-6 Hatsutomi, Kamagaya, Chiba |
| Narita Tomisato Tokushukai Hospital | 1-1-1 Hiyoshidai, Tomisato, Chiba |
| Chiba Tokushukai Hospital | 2-11-1 Takanedai, Funabashi, Chiba |
| Hanyu General Hospital | 551 Kamiiwase, Hanyu, Saitama |
| Minano Hospital | 2031-1 Minano, Minano-machi, Chichibu-gun, Saitama |
| Shizuoka Tokushukai Hospital | 11-1 Shimokawahara-minami, Suruga-ku, Shizuoka |
| Haibara General Hospital | 2887-1 Hosoe, Makinohara, Shizuoka |
| Shirane Tokushukai Hospital | 2294-2 Nishino, Minami-Alps, Yamanashi |
Chubu
| Hospital | Address |
|---|---|
| Nagoya Tokushukai Hospital | 2-52 Kozoji-cho-kita, Kasugai, Aichi |
| Ogaki Tokushukai Hospital | 6-85-1 Hayashi-machi, Ogaki, Gifu |
Kinki
| Hospital | Address |
|---|---|
| Suita Tokushukai Hospital | 21-1 Senrioka-nishi, Suita, Osaka |
| Matsubara Tokushukai Hospital | 7-13-26 Amami-higashi, Matsubara, Osaka |
| Kishiwada Tokushukai Hospital | 4-27-1 Kamori-cho, Kishiwada, Osaka |
| Izumi City General Hospital | 4-5-1 Wake-cho, Izumi, Osaka |
| Nozaki Tokushukai Hospital | 2-10-50 Tanigawa, Daito, Osaka |
| Yao Tokushukai General Hospital | 1-17 Wakakusa-cho, Yao, Osaka |
| Ikoma City Hospital | 1-6-2 Higashi-Ikoma, Ikoma, Nara |
| Uji Tokushukai Hospital | 145 Ishibashi, Makishima-cho, Uji, Kyoto |
| Omi Kusatsu Tokushukai Hospital | 3-34-52 Higashiyagura, Kusatsu, Shiga |
| Kobe Tokushukai Hospital | 1-3-10 Kamitakamaru, Tarumi-ku, Kobe, Hyogo |
| Takasago Seibu Hospital | 1-10-41 Nakasuji, Takasago, Hyogo |
| Higashiosaka Tokushukai Hospital | 3-6-11 Hishie, Higashiosaka, Osaka |
| Higashisano Hospital | 969-1 Tsuruhara, Izumisano, Osaka |
Chugoku
| Hospital | Address |
|---|---|
| Izumo Tokushukai Hospital | 3964-1 Naoe, Hikawa-cho, Izumo, Shimane |
Shikoku
| Hospital | Address |
|---|---|
| Uwajima Tokushukai Hospital | 2-6-24 Sumiyoshi-cho, Uwajima, Ehime |
Kyushu
| Hospital | Address |
|---|---|
| Fukuoka Tokushukai Hospital | 4-5 Sugukita, Kasuga, Fukuoka |
| Futsukaichi Tokushukai Hospital | 4-8-25 Futsukaichi-chuo, Chikushino, Fukuoka |
| Nagasaki Kita Tokushukai Hospital | 1-5-1 Hokuyodai, Nagayo-cho, Nishisonogi-gun, Nagasaki |
| Kagoshima Tokushukai Hospital | 3-8-1 Shimoarata, Kagoshima |
| Osumi Kanoya Hospital | 6081-1 Shinkawa-cho, Kanoya, Kagoshima |
| Yamakawa Hospital | 1571 Yamakawa-ogawa, Ibusuki, Kagoshima |
| Yakushima Tokushukai Hospital | 2467 Miyanoura, Yakushima-cho, Kumage-gun, Kagoshima |
| Naze Tokushukai Hospital | 28-1 Naze-asahi-machi, Amami, Kagoshima |
| Kikai Tokushukai Hospital | 315 Wan, Kikai-cho, Oshima-gun, Kagoshima |
| Setouchi Tokushukai Hospital | 1358-1 Tonkyanbaru, Koniya, Setouchi-cho, Oshima-gun, Kagoshima |
| Tokunoshima Tokushukai Hospital | 7588 Kametsu, Tokunoshima-cho, Oshima-gun, Kagoshima |
| Okinoerabu Tokushukai Hospital | 2208 Serikaku, China-cho, Oshima-gun, Kagoshima |
| Yoron Tokushukai Hospital | 403-1 Chabana, Yoron-cho, Oshima-gun, Kagoshima |
| Kasari Hospital | 120 Nakaganeku, Kasari-cho, Amami, Kagoshima |
Okinawa
| Hospital | Address |
|---|---|
| Miyakojima Tokushukai Hospital | 552-1 Hirara-matsubara, Miyakojima, Okinawa |
| Ishigakijima Tokushukai Hospital | 446-1 Minami-Ohama, Ohama, Ishigaki, Okinawa |
| Chubu Tokushukai Hospital | 2-1 Awase Land Readjustment Project Area, Kitanakagusuku-son, Nakagami-gun, Okinawa |
| Chatan Hospital | 631-4 Kamiseido, Chatan-cho, Nakagami-gun, Okinawa |
| Nanbu Tokushukai Hospital | 171-1 Hoka, Yaese-cho, Shimajiri-gun, Okinawa |
As of 2026-10
Contact Us
Contact the Tokushukai Information System Department to discuss business intelligence for hospital management.
Contact Us by Phone
06-7222-8386
Weekdays, 9:00–17:00 (development team)